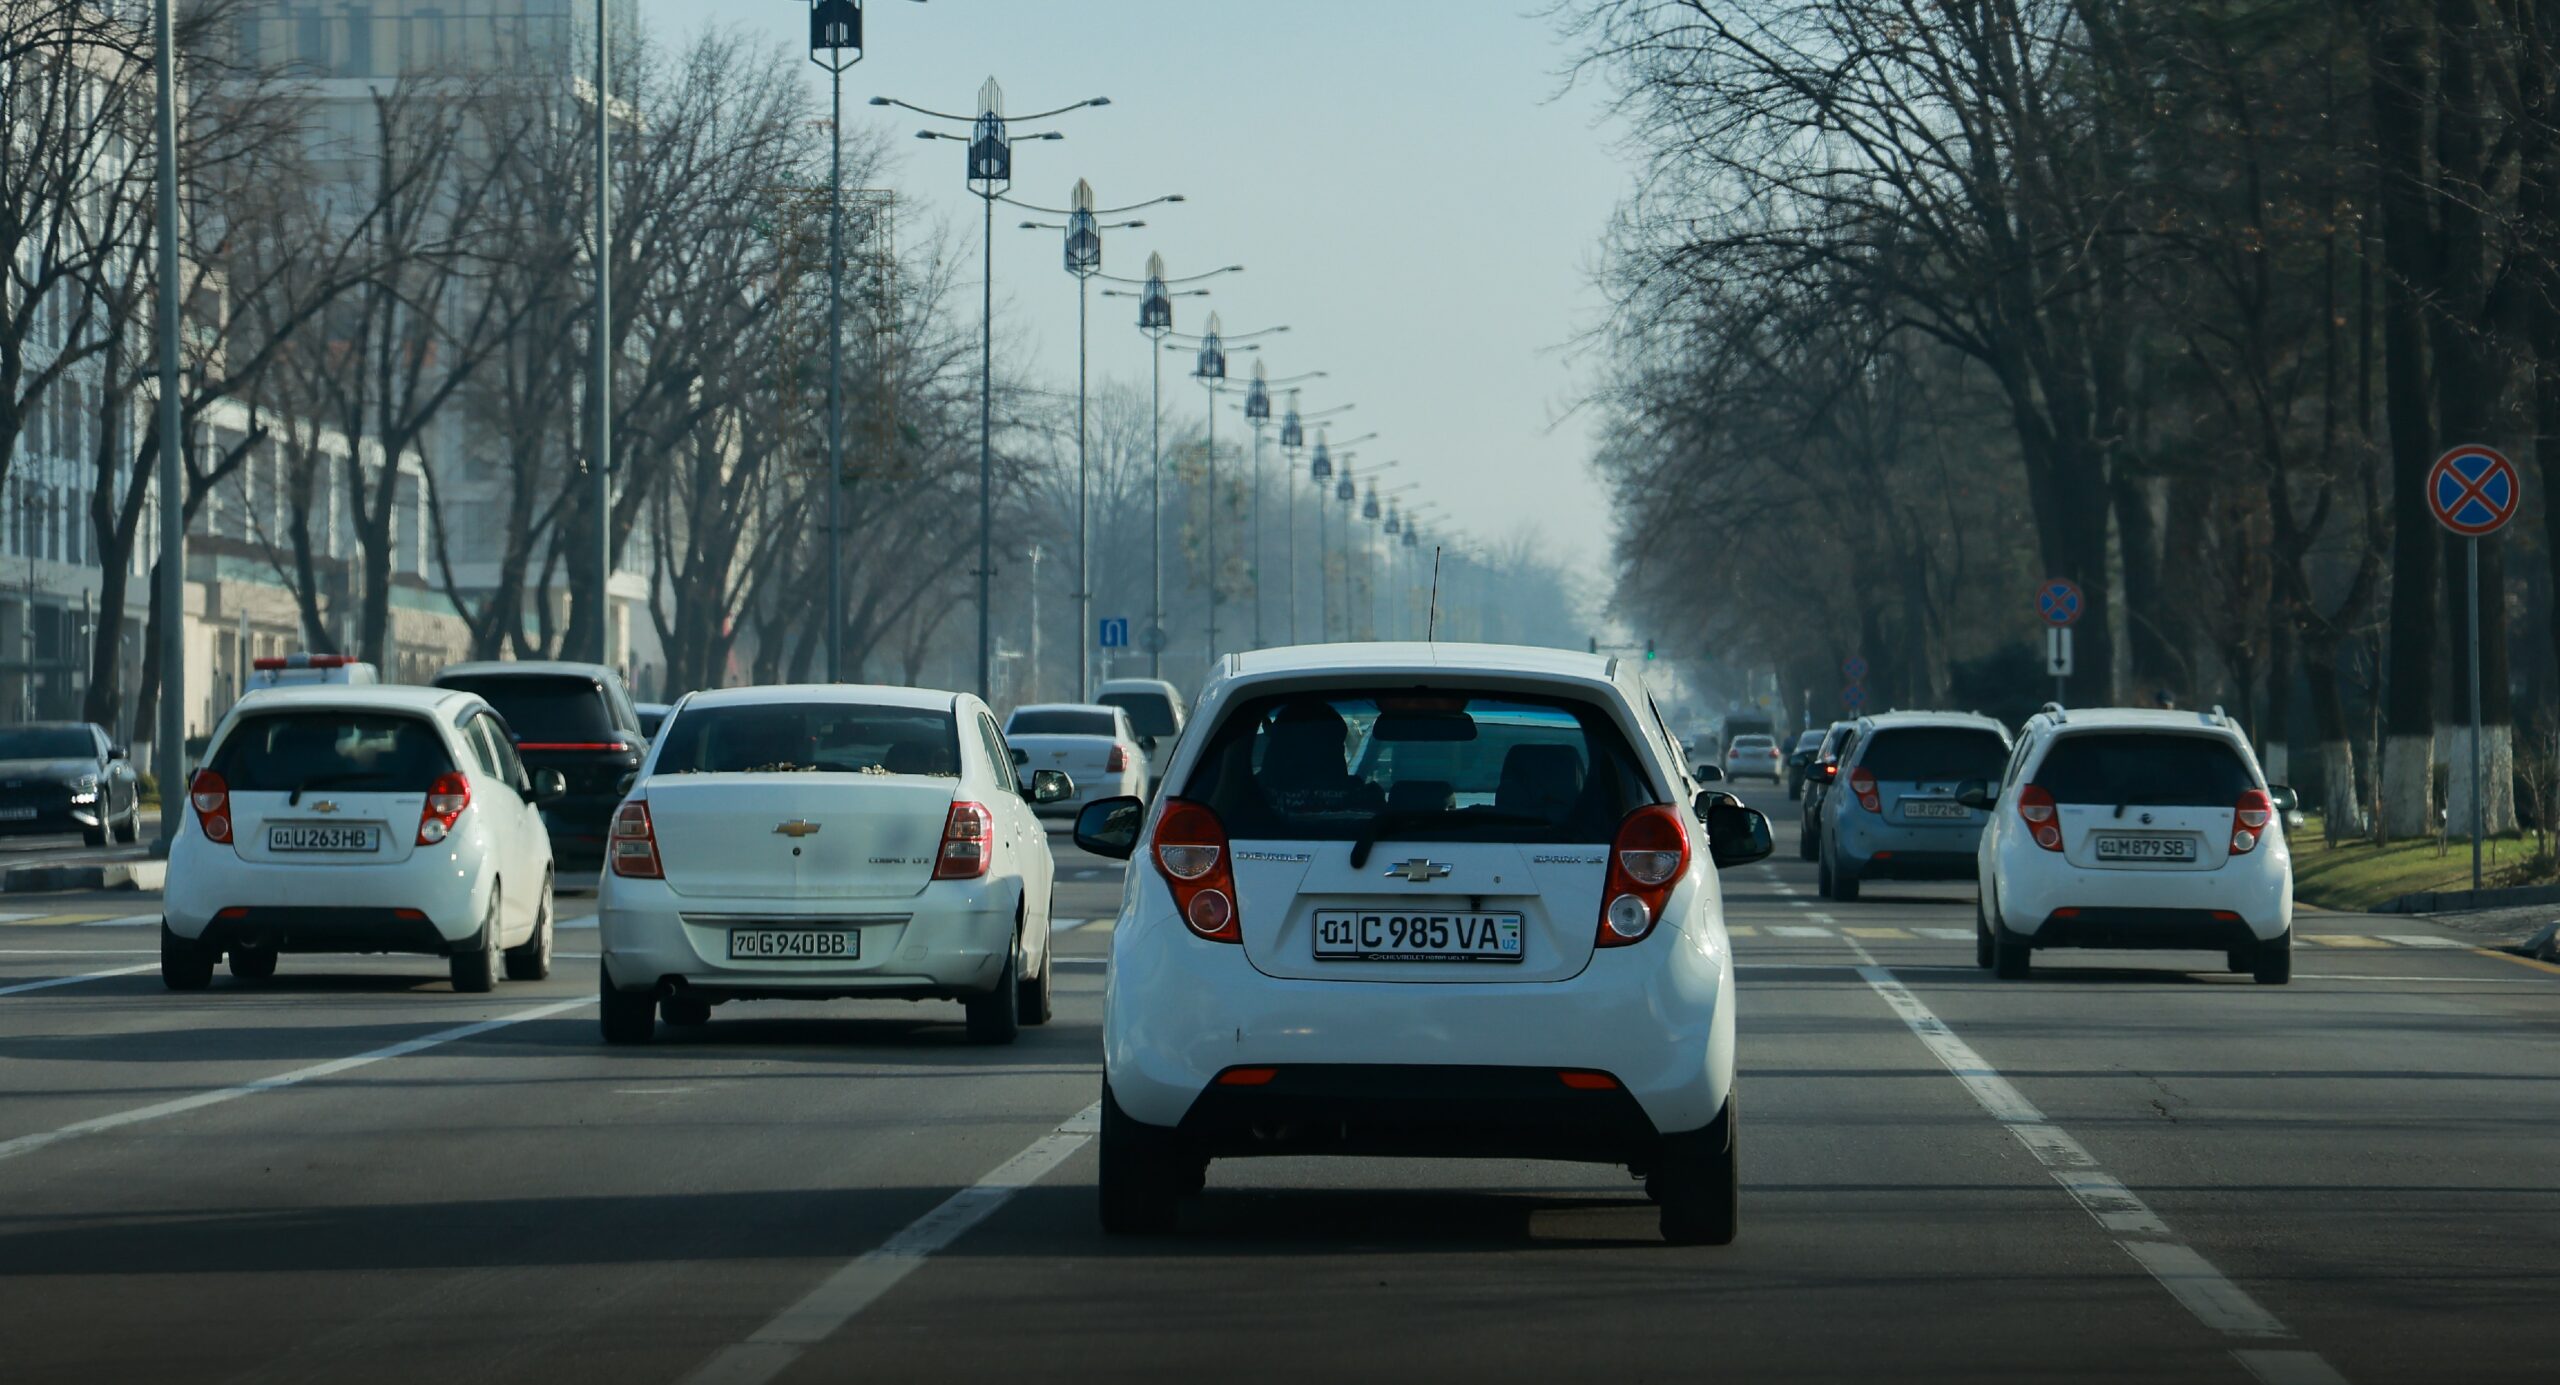
Atmospheric air control in Tashkent is carried out by the Agency of the Hydrometeorological Service under the Ministry of Ecology, Environmental Protection, and Climate Change through 15 automatic stations. During monitoring, such indicators as air dust, sulfur dioxide, nitrogen dioxide, nitrogen oxide, carbon monoxide, phenol, hydrogen fluoride, ammonia, formaldehyde, heavy metals, and fine particles PM10 and PM2.5 are observed.
Information on atmospheric pollution is integrated on the website of the Ministry of Ecologyhttps://eco.gov.uz/en/meteo/index, and is also presented on the IQAir website and on the “Uzhydromet’s” platformhttps://monitoring.meteo.uz/en.
Air pollution is currently being compared with the recommendations of the World Health Organization (WHO), which are difficult to achieve due to the geographical and climatic characteristics of our republic. According to him, the average annual amount of PM 2.5 is 5 mсg/m3, and the average daily amount is 15 mсg/m3. In no country in the world do the indicators meet the standards recommended by WHO, many countries have adopted their own national standards.
For reference, this norm is 12 mcg/m3 in the USA and Mexico, 15 mcg/m3 in Belarus and Japan, 25 mcg/m3 in the EU, 20 mcg/m3 in Russia, 35 mcg/m3 in China, and 40 mcg/m3 in India. There is no PM 2.5 standard in South Korea.
It is important to note that Uzbekistan, in cooperation with the Ministry of Health, is currently implementing a project to develop a national air quality monitoring platform and mobile application. According to this, national air quality standards will be developed, taking into account the number of fine particles in the air and their impact on the population. In 2023, the project began studying the level of morbidity of the population from air pollution in Surkhandarya, Bukhara, Khorezm regions and the Republic of Karakalpakstan.
At the same time, the current indicator of air pollution level in the country is the сomprehensive Air Pollution Index (API), which is calculated based on priority pollutants for a certain region.
API indicators in Tashkent in 2010-2023 y.
Air Pollution Quality Criteria
| City
|
Monitored Years | ||||||||
| 2015 | 2016 | 2017 | 2018 | 2019 | 2020 | 2021 | 2022 | 2023 | |
| Tashkent | 3,51 | 3,55 | 4,10 | 3,66 | 3,42 | 3,17 | 4,67 | 3,75 | 4,21 |
As the table shows, the level of air pollution has increased in recent years. In addition, the amount of dust in the air of Tashkent exceeded the maximum permissible concentration by 1.3 times.
Annual dust concentrations from 2015 to 2023.
| City
|
Monitored Years | ||||||||
| 2015 | 2016 | 2017 | 2018 | 2019 | 2020 | 2021 | 2022 | 2023 | |
| Tashkent | 0,7 | 0,7 | 1,3 | 1,3 | 0,7 | 0,7 | 1,3 | 0,9 | 0,6 |
January turned out to be the most polluted month of 2023 on the IQAir scale, according to data from automatic air pollution monitoring stations in Tashkent.
Air quality in Tashkent city according to IQAir index in 2023
| Month | Level of pollution (amount of days) | ||||
| good | moderate | unhealthy | harmful | Very harmful | |
| January | 1 | 8 | 3 | 19 | – |
| February | 2 | 19 | 7 | – | – |
| March | 4 | 26 | 1 | – | – |
| April | 3 | 27 | – | – | – |
| May | 3 | 15 | 1 | – | – |
| June | 8 | 6 | – | – | – |
| July | 7 | 24 | – | – | – |
| August | 7 | 24 | – | – | – |
| September | 5 | 23 | 2 | – | – |
| October | 1 | 24 | 5 | 1 | – |
| November | 3 | 17 | 9 | 1 | – |
| December | 1 | 14 | 11 | 5 | – |
| Totally*: | 45 | 227 | 39 | 26 | |
In 2023*, no information was transmitted for 28 days for technical reasons
According to WHO recommendations, air pollution is dangerous to health and causes strokes, cardiovascular diseases, respiratory diseases and lung cancer.
For information, we have previously reported that air pollution in Tashkent is caused by pollutant emissions from natural and anthropogenic sources. This project is being implemented in order to improve the standard of living and health of the population by introducing automatic monitoring stations to obtain reliable quality information online, expanding the air pollution monitoring system in the cities of the republic, etc.
Source https://eco.gov.uz/en/site/news?id=3916

