
Tools
- All
- Agriculture
- Climate
- Energy
- Health
- Water

Website of the project Land Management, Environment & Solid-Waste: Inside Education and Business in Central Asia” (LESLIE)
The website of the project Land Management, Environment & Solid-Waste: Inside Education and Business in Central Asia” (LESLIE), under the Erasmus+ Programme established by the European Education and Culture Executive Agency (EACEA) was launched today. The primary objective of LESLIE is to equip Central Asian Higher Education Institutions (HEIs) with the necessary tools and capacities …
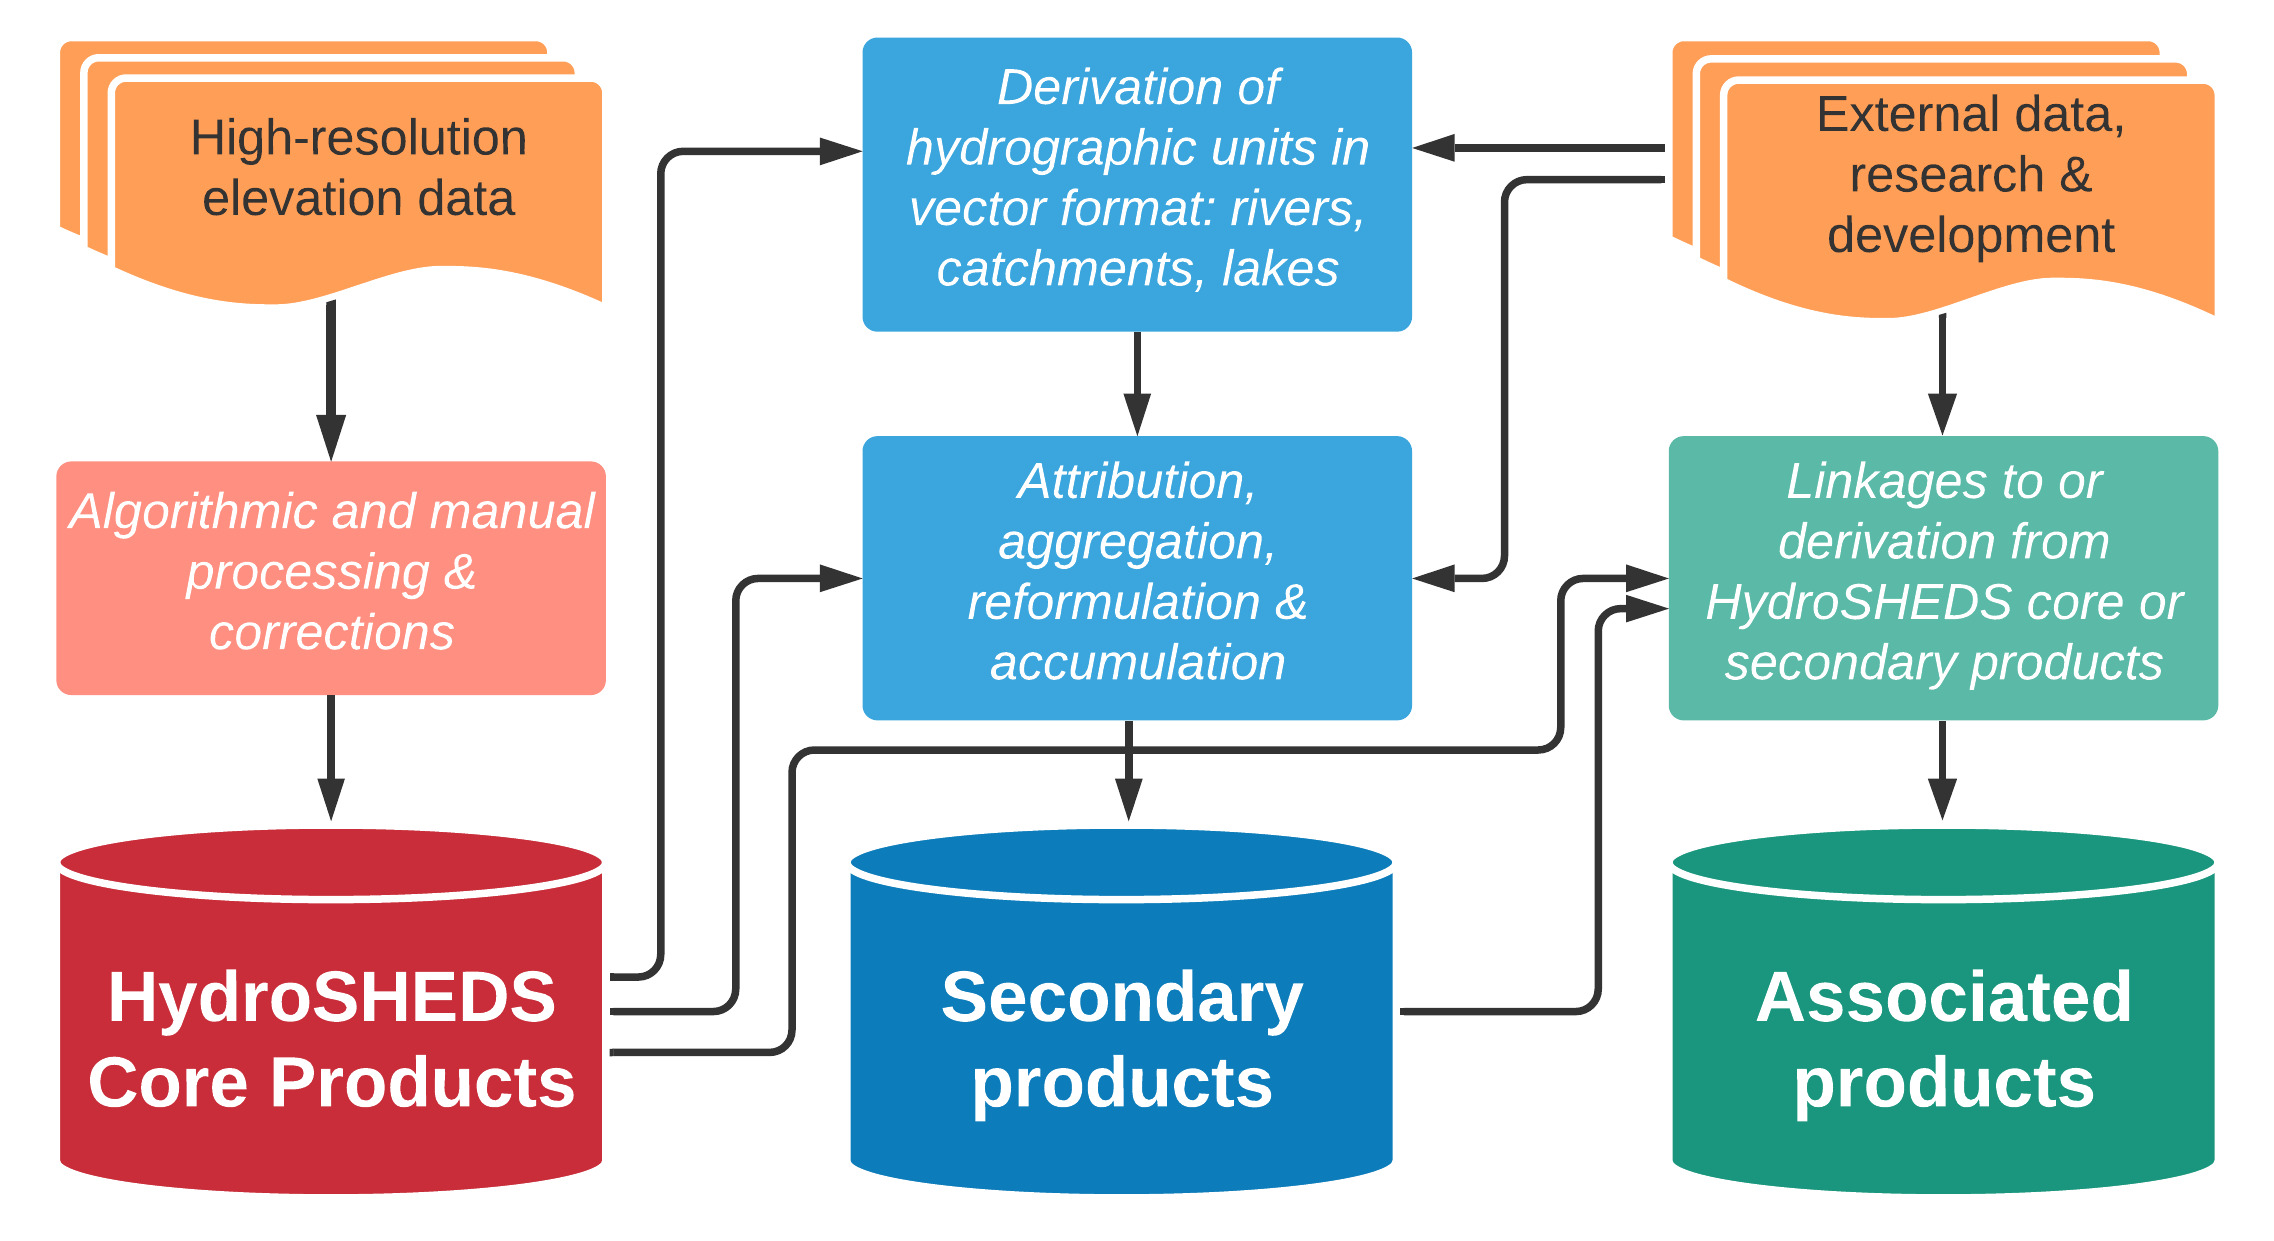
HydroSHEDS
The HydroSHEDS project was initiated in 2006 by World Wildlife Fund US with the goal to create free digital data layers in support of large-scale hydro-ecological research and applications worldwide. HydroSHEDS provides seamless hydrographic data products including catchment boundaries, river networks, and lakes. The various existing sub-datasets are consistent across multiple scales and resolutions in …
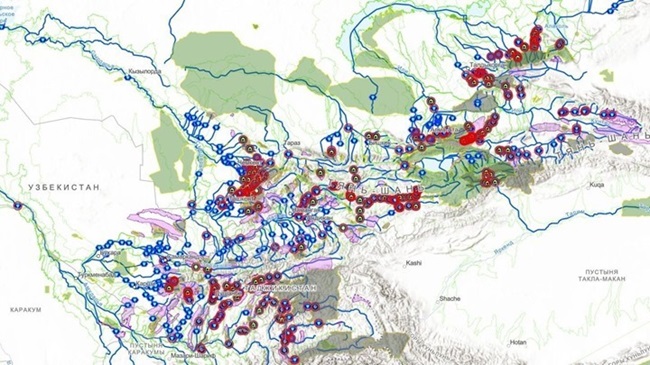
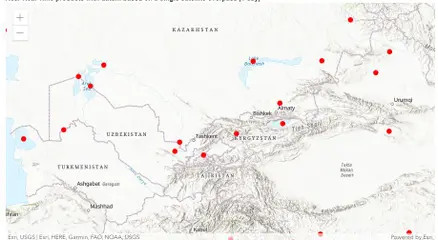
Map of the impact of hydroelectric power stations on the ecosystems of Central Asia
Link to web map: https://rivers.help/map Specialists from the Rivers Without Borders Foundation have been developing their own GIS model for a whole year, and today their publicly available interactive database includes about 300 existing large and medium-sized dams used for hydropower or irrigation in the Balkhash-Alakol, Chu-Talas, Syrdarya and Amudarya and smaller river basins. About …
Map of the impact of hydroelectric power stations on the ecosystems of Central Asia Read More »
30+ Climate Technology Statistics
Climate change is one of the most pressing issues of our time. To ensure that our planet can continue supporting human life, we need to minimize the volume of greenhouse gasses entering the Earth’s atmosphere and ensure that we protect the environment from other harms. This is where climate technology – usually called climate tech …
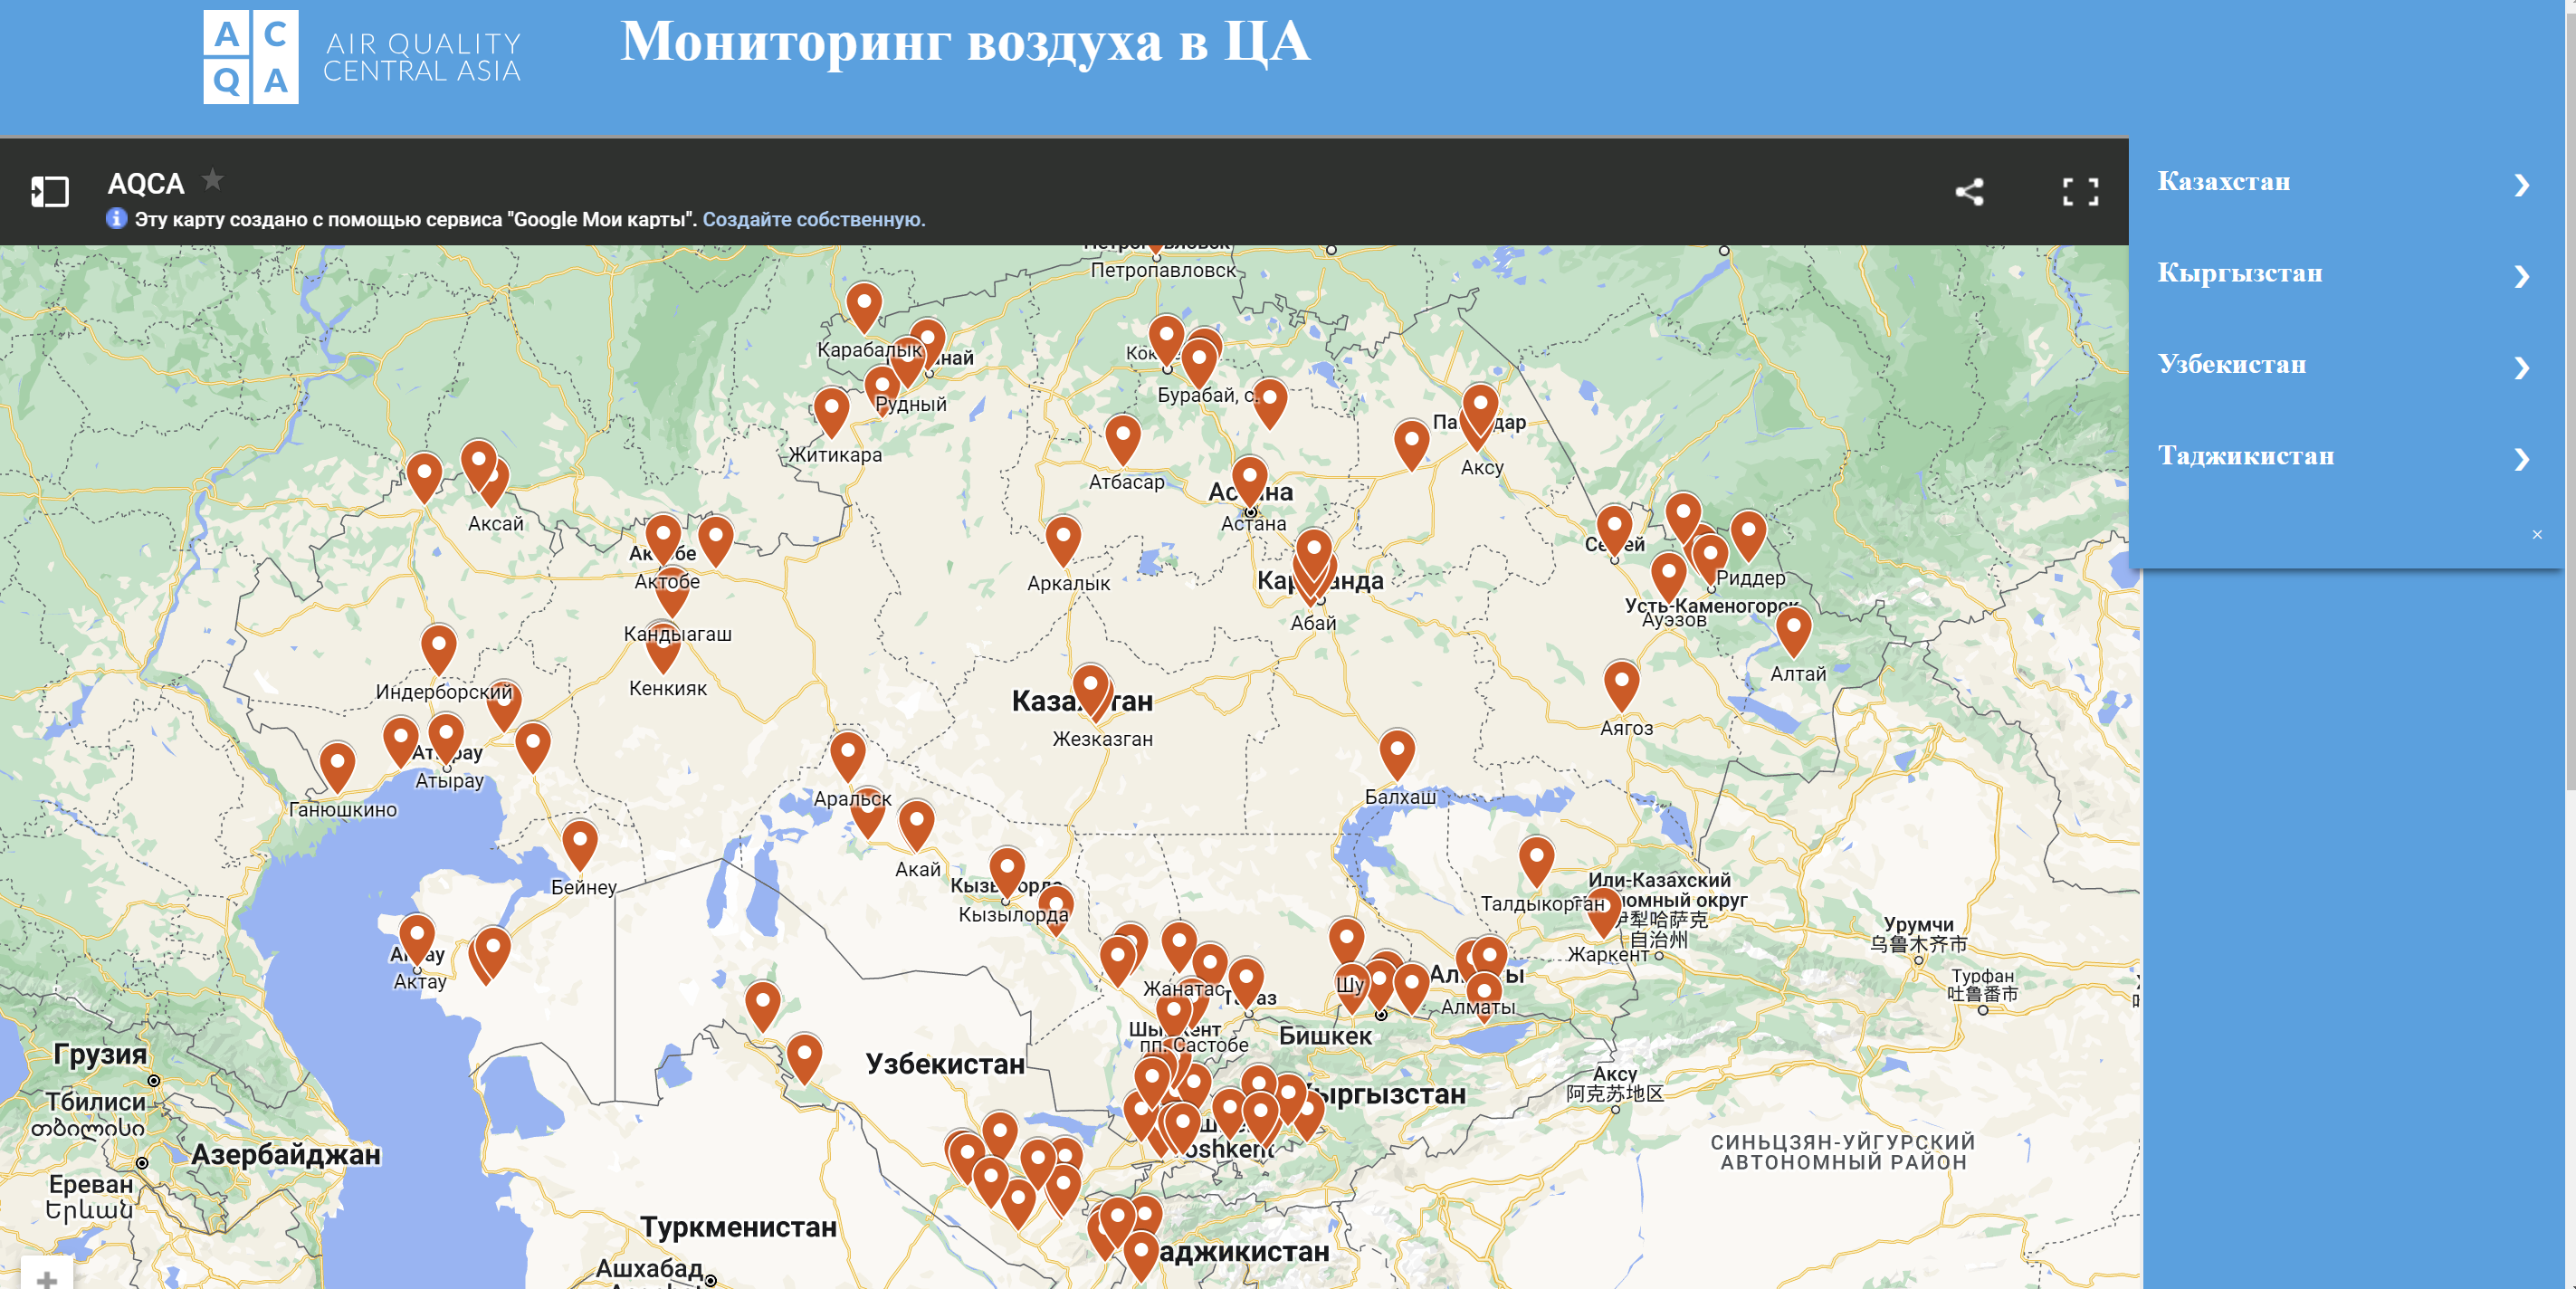
AQCA – Central Asian Air Quality Platform
AQCA – Central Asian Air Quality Platform This platform was initiated by a group of actors working on the topic of air quality in Central Asia in March 2022. At the moment, more than 30 organizations in the region are members of the platform. AQCA is a platform for: Initiating an …
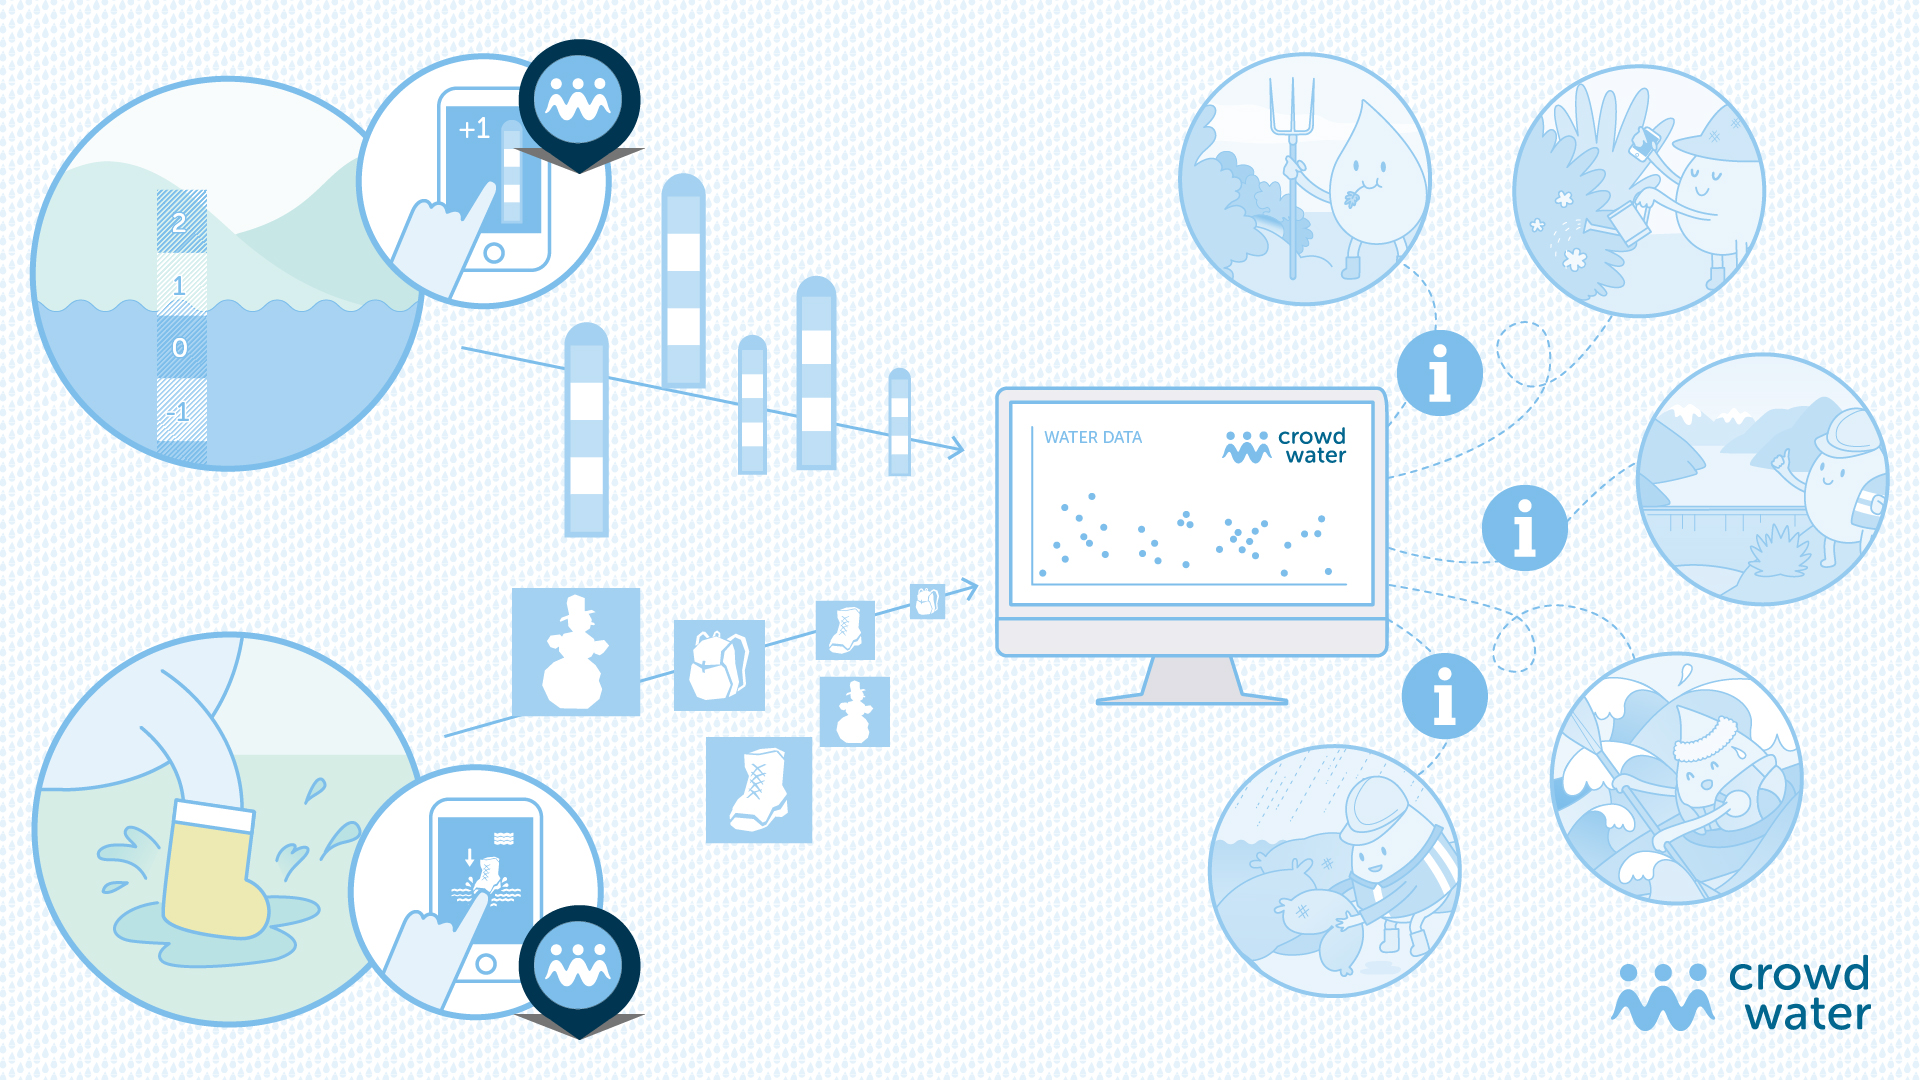
CrowdWater
CrowdWater stands for an independent and reliable data collection by citizens – Citizen Science – for modelling of floods and droughts and as a supplement to existing measurements. The method is developed scientifically by the University of Zurich such that it can be applied in remote areas and regions with low data availability. Welcome
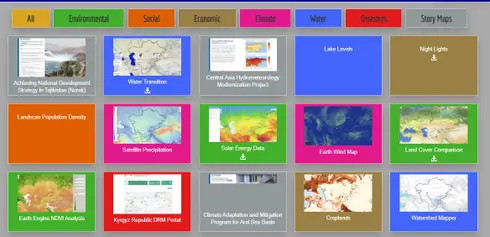
Central Asia Water and Energy Data Portal
The Central Asia Water & Energy Data Portal is available in English and Russian language and covers the five countries of Central Asia including Afghanistan. The data portal includes many new high-quality datasets available from a number of institutions (e.g. UN agencies, NASA, NOAA, CIESIN, IRI, The World Bank, etc.). It contains datasets on various topics, such as: Environment, Social, Economic, Climate, Water, and Disaster
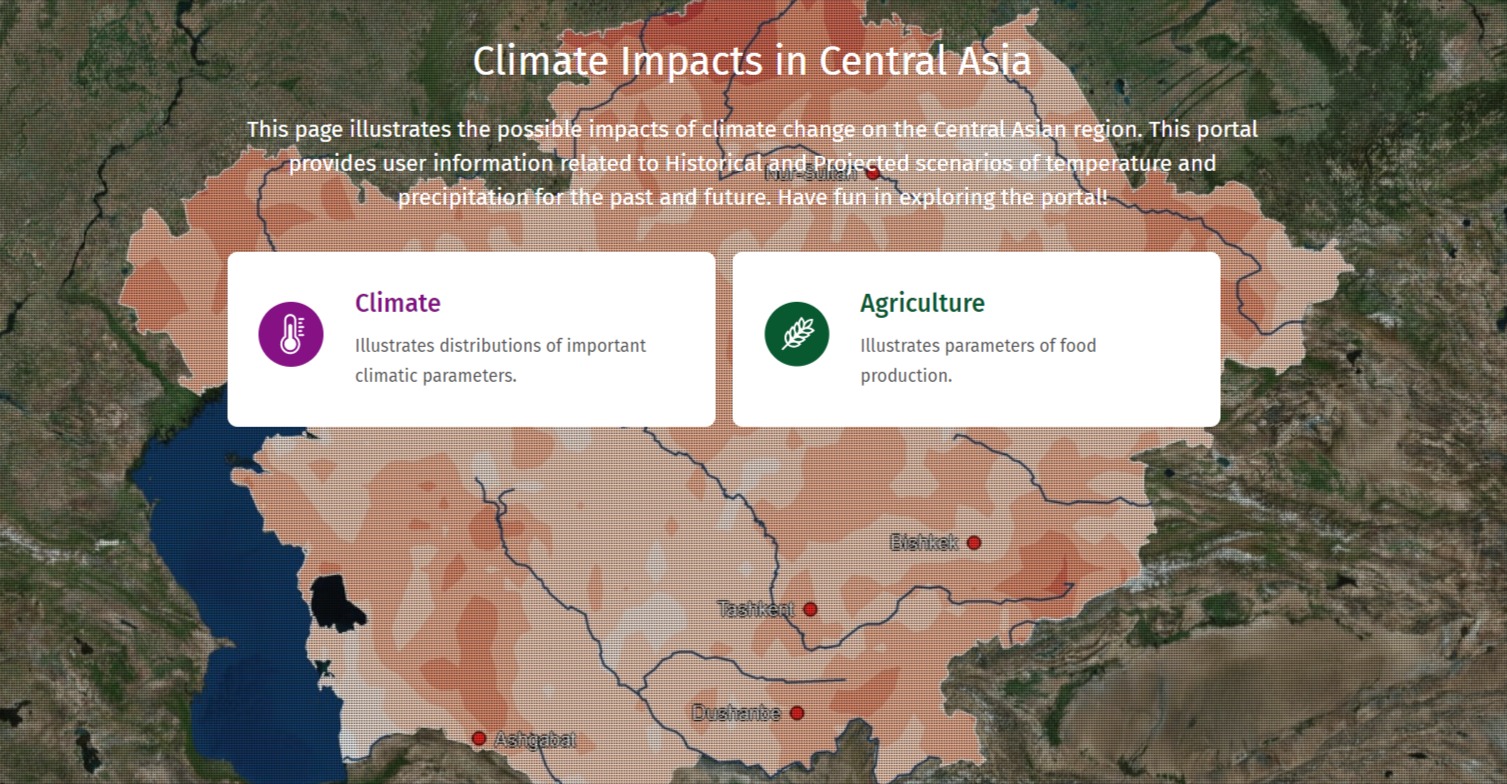
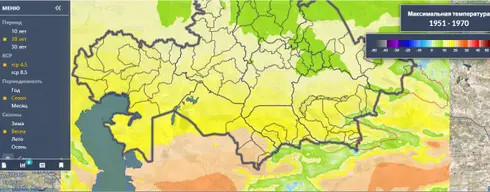
Climate Impacts in Central Asia
The “ClimateImpactsOnline” portal is a result of research on climate impact for different sectors (agriculture, forestry, hydrology, energy and tourism) developed at the Potsdam Institute for Impact Research Climate (PIK). Within the portal, parameters such as temperature, crop yields or forest fire risk can be selected and displayed for various time periods. The selected parameters are shown as a color map and detailed representations can be accessed via three integrated zoom levels by clicking on selected regions. In addition, the portal provides teaching materials, background information and a glossary. PIK released the first version of the portal for Germany in 2013 and made available the versions for Peru, India and Tanzania by 2021. Meanwhile, the Sahel region and Central Asia are available as well. To be updated on the most recent developments, you can join the ClimateImpactsOnline mailing list.
Source: http://kfo.pik-potsdam.de//ca/index_en.html?language_id=en
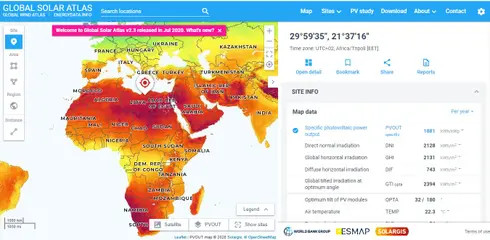
Global Solar Atlas
The primary aim of thе Global Solar Atlas is to provide quick and easy access to solar resource and photovoltaic power potential data globally, at a click of a mouse.
Source: https://globalsolaratlas.info/map?s=29.993002,21.621094&m=site
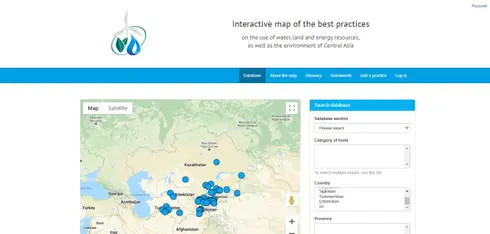
Interactive map of the best practices in Central Asia
The tool means an approach, technology, method or combination of methods and measures, or organization of process for sustainable and rational use of water, land, and energy resources and protection of environment.
Source: http://www.cawater-info.net/best-practices/en/base/index
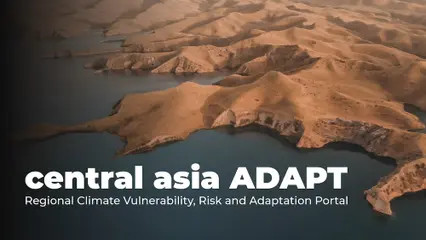
Central Asia ADAPT
The Central Asia Water & Energy Data Portal is available in English and Russian language and covers the five countries of Central Asia including Afghanistan. The data portal includes many new high-quality datasets available from a number of institutions (e.g. UN agencies, NASA, NOAA, CIESIN, IRI, The World Bank, etc.). It contains datasets on various topics, such as: Environment, Social, Economic, Climate, Water, and Disaster
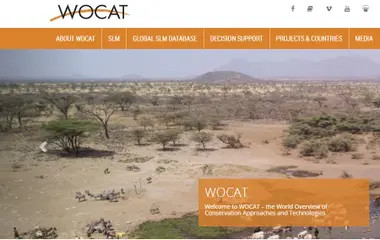
WOCAT
World Overview of Conservation Approaches and Technologies (WOCAT) provides tools that allow specialists in sustainable land management (SLM) to identify field sand needs of action, share their knowledge in land management, search for appropriate SLM technologies, and support them in making decisions in the field and at the planning level and in upscaling identified best practices.
Source: https://qcat.wocat.net/ru/wocat/
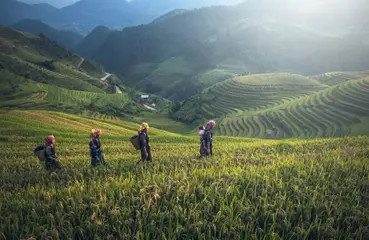
Sustainable Land Management Tajikistan
Sustainable Land Management Tajikistan (SLMTJ) is a knowledge platform on Sustainable Land Management in Tajikistan. The SLMTJ Knowledge Platform will provide access to the knowledge materials and aims to strengthen the collection, sharing and dissemination of best practices and methodologies on SLM among different stakeholders.
Source: https://slmtj.net/
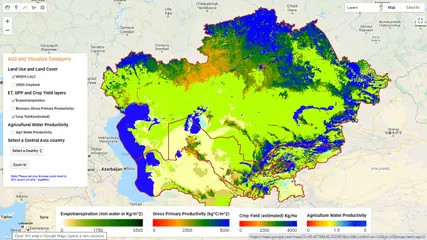
Agricultural Water Productivity
Agriculture Water Productivity Mapping for Central-Asia (AWP-CA) is the Google Earth Engine supported on-the fly web mapping tool by harvesting open access data and also calculating derived indices and products for the given period. Tool display data and relative production variability across the region or zoom to specific country. The framework of AWP can be a convenient tool to evaluate the performance production systems at spatial and temporal scales.
Source: http://geoagro.icarda.org/
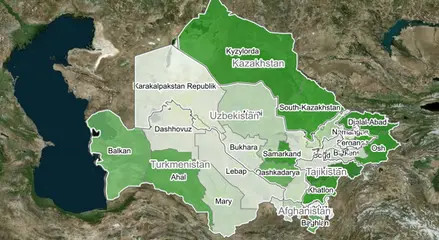
WUEMoCA
Water Use Efficiency Monitor in Central Asia (WUEMoCA) is an operational scientific web mapping tool for the regional monitoring of land and water use efficiency in the irrigated croplands of the transboundary Aral Sea Basin that is shared by Kazakhstan, Kyrgyzstan, Tajikistan, Turkmenistan, Uzbekistan, and Afghanistan. Satellite data on land use, crop production and water consumption are integrated with hydrological and economic information to provide of a set indicators.
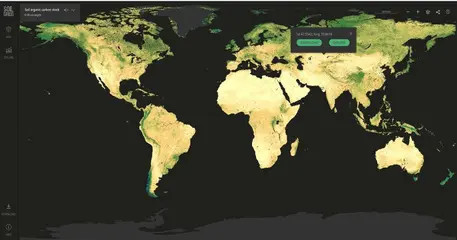
Earth Map
Earth Map is an innovative, free and open-source tool developed by the FAO. It was created to support countries, research institutes, farmers and members of the genral public with internet access to monitor their land in an easy, integrated and multi- temporal manner. It provides satellite imagery and global datasets on climate, vegetation, fires, biodiversity, geo-social and other topics. Users need no prior knowledge of remote sensing or Geographical Information Systems (GIS).
Source: https://earthmap.org/
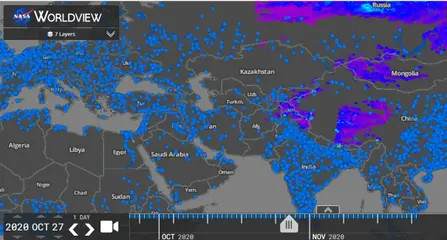
Snow water equivalent map
The tool shows the daily SWE estimates in millimeters (mm) based on the Advanced Microwave Scanning Radiometer-E/Advanced Microwave Scanning Radiometer-2 (AMSR-E/AMSR2)
Source: NASA Worldview
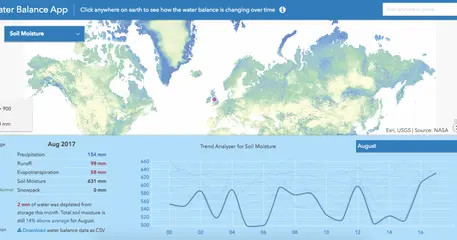
Water Balance
The app is based on data from NASA’s Global Land Data Assimilation System (GLDAS-2.1), which uses weather observations like temperature, humidity, and rainfall to run the Noah land surface model. This model estimates how much of the rain becomes runoff, how much evaporates, and how much infiltrates into the soil. These output variables, calculated every three hours, are aggregated into monthly averages, giving us a record of the hydrologic cycle going all the way back to January 2000.
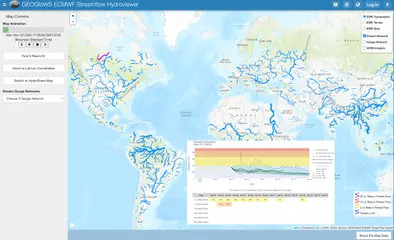
GEOGloWS ECMWF Streamflow Service
GEOGloWS helps to organize the international community engaged in the hydrologic sciences, observations, and their application to forecasting and provides a forum for government-to-government collaboration, and engagement with the academic and private sectors to achieve the delivery of actionable water information
Source: GEOGloWS
Global Reservoirs and Lakes Monitor (G-REALM)
G-REALM provides time-series of water level variations for some of the world’s largest lakes and reservoirs. Currently, lakes ≥ 100km2 are included but future project phases will aim to include those in the 50-100km2 size range.
Source: USDA/FAS/OGA
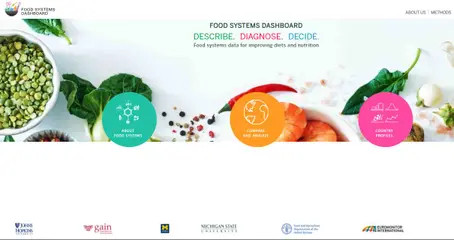
Food Systems Dashboard
The food system is all of the people and activities that play a part in growing, transporting, supplying, and, ultimately, eating food. These processes also involve elements that often go unseen, such as food preferences and resource investments.

Google Earth
Google Earth is a computer program that renders a 3D representation of Earth based primarily on satellite imagery. The program maps the Earth by superimposing satellite images, aerial photography, and GIS data onto a 3D globe, allowing users to see cities and landscapes from various angle.
Source: https://www.google.com/earth/
SoilGrids
SoilGrids is a system for global digital soil mapping that uses state-of-the- art machine learning methods to map the spatial distribution of soil properties across the globe. SoilGrids prediction models are fitted using over 230 000 soil profile observations from the WoSIS database and a series of environmental covariates.
Source: https://soilgrids.org/
GIEWS Food and Agriculture Early Warning
Global Information and Early Warning System on Food and Agriculture (GIEWS) monitors the condition of major foodcrops to assess production prospects. GIEWS utilizes remote sensing data that can provide a valuable insight on water availability and vegetation health during the cropping seasons. It provide maps and graphs at country level, depicting the latest 36-month period of the seasonal, vegetation and precipitation indicators. and presenting data by dekad and month.
Source: http://www.fao.org

AReS
The Agricultural Research e-Seeker (AReS) is a tool to discover, explore, and retrieve content from information and data repositories linked to CGIAR and its partners. It is designed to help make CGIAR knowledge findable, accessible, inter-operable and re-usable.
Source: http://cgspace.cgiar.org/
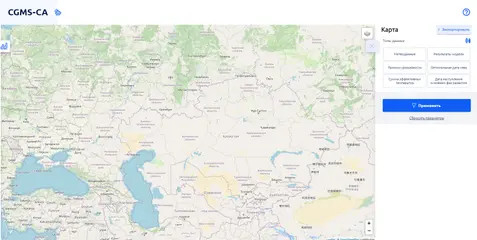
The Crop Growth Monitoring System for Central Asia (CGMS-CA)
The Crop Growth Monitoring System for Central Asia (CGMS-CA) allows monitoring the conditions for the growth and development of crops and forecasting their yields for the countries of the Central Asian region, including Kazakhstan, Uzbekistan and Turkmenistan. CGMS-CA allows to assess the conditions of growth, development and accumulation of productive biomass in a significant list of agricultural crops in the region – winter wheat, spring wheat, cotton, spring rapeseed, lentils and rice. For each country of the region, the system has been adapted, considering some specifics of each one in terms of information, methodology and technology. The main steps of technological adaptation of the CGMS-CA system includes: development of a meteorological database for the certain period (not less than 10 years) using standard meteorological observations of the Hydrometeorological network and free available NASA Power data (https://power.larc.nasa.gov/); development of a soil characteristics database, by finding a correspondence between the taxonomy of the digital soil map and the classification of soils WRB; development of a phenological characteristics database such as sown dates, dates of emergence, anthesis and maturity obtained from agrometeorological stations network of the National Hydrometeorological services of the region; development of a statistical crop yields database at the regional and district levels of each country of the region. One of the main specifics of the CGMS-CA are estimation of biophysical parameters of crop development based of simulations of WOFOST (WOrld FOod Studies) model and possibility to display the results of the simulations at the different administrative levels based on a spatial schematization and aggregation. The prediction of crop yields in the context of administrative units is based on statistical methods (pair and multiple regression). CGMS-CA has been developed by specialists of the Ukrainian Hydrometeorological Institute (https://uhmi.org.ua/) as part of a joint project with the Regional Environmental Center of Central Asia (https://carececo.org/main/)
Source: https://cgms-ca.uhmi.org.ua/
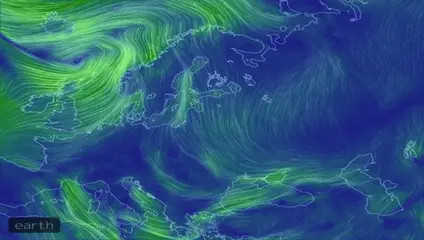
Earth Wind
Earth Wind is an interactive map that shows up-to-date currents across the globe. The website uses numerical data from various weather bodies and recreates them on an interactive globe. The data is updated every three hours and shows the winds as tendrils snaking over the land and sea. The result is a visually astonishing globe that also provides wind data on any location with the click of a button.
Source: https://earth.nullschool.net/
Kazakhstan Climate Change
Climate Change Portal developed by the Institute of Geography of Kazakhstan. The Institute’s research is focused on solving environmental problems and assessing the natural resource potential of Kazakhstan’s geosystems with the development of the geographical foundations of rational nature management. The portal collects historical analysis about temperature, precipitation, evapotranspiration and agro-climatic indicators (aridity index, standardized precipitation, …)
Source: https://geoportal.ingeo.kz/
Central Asia Climate Dynamics
This tool will generate the time series of the selected meteorological variable for the selected time-period for any location in any of the selected Central Asian countries.
Source: https://earthengine.google.com/
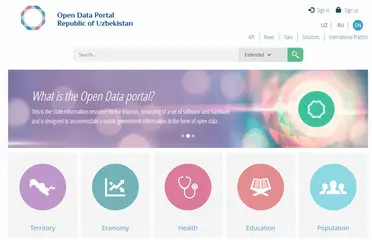
Ecology Data Portal of the Republic of Uzbekistan
This tool presents various data in the field of environmental protection relevant to the territory of the Republic of Uzbekistan. Here You can find data on institutions responsible for the protection of the environment, the indicators of their activities, statistics in the field, data on the red book of the Republic of Uzbekistan.
Source: http://data.gov.uz/
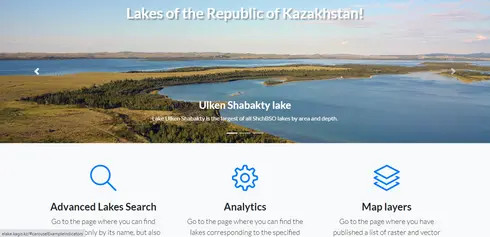
E-lake Kazakhstan
The web application E-Lake was developed by the Institute of Geography of the Republic of Kazakhstan. The information is presented in the form of interactive layers of maps, tables, and graphs. At the moment, the Atlas of Lakes contains information about location and general characteristics of 2328 lakes in Kazakhstan with area more than 1 km2. The web- resource is developed for decision-makers in the field of water management, for the scientific and educational community, and for all who want to learn more about lakes.
Source: elake.kagis/
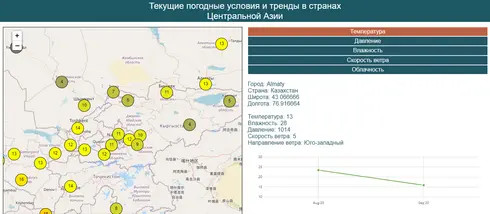
Current weather and trends in Central Asia
The tool displays main meteorological parameters: current temperature, pressure, humidity, wind speed and cloud cover data for more than 890 geographical locations in Central Asia. The information is updated every 3 hours. The users can also analyze the dynamics of the monthly average values of these parameters using the trend chart that is updated in the beginning of each month.
Source: https://openweathermap.org/
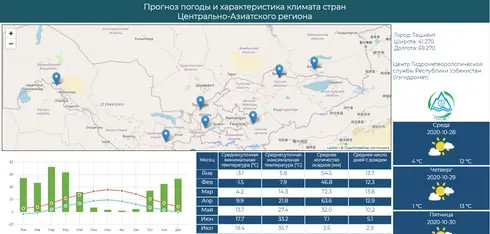
Weather forecast and climate characteristics in Central Asia
The CACIP Weather Forecasts and Climate Characteristics tool displays weather forecasts from the National Hydrometeorological Organizations. The tool also allows to review and analyze monthly long term averages for minimum and maximum temperature parameters, precipitation and number of rainy days.
Source: https://public.wmo.int/
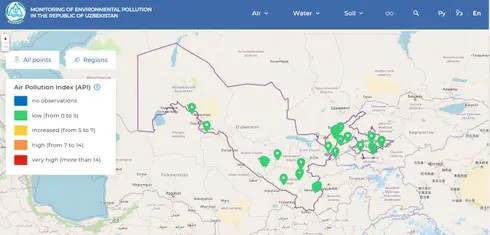
Monitoring of environmental pollution in the Republic of Uzbekistan
Interactive map that provides observations of the state of atmospheric air on the territory of the Republic of Uzbekistan conducted in 25 cities at 63 stationary pollution observation points (POP). Observations are made daily with a frequency of 3 times a day (7:00; 13:00; 19:00 local time).
Source: UzHydromet
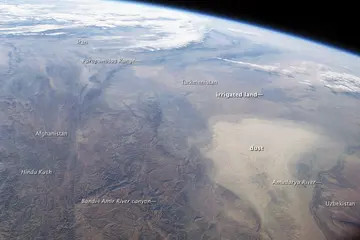
Dust diffusion
The tool shows the dust diffusion and its dynamics from different perspectives (with data derived from different sensors and different time stamp).
Source: NASA Worldview
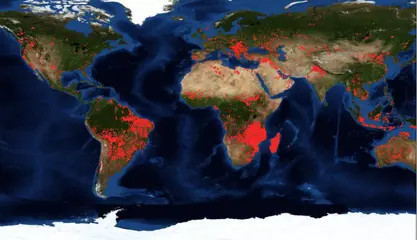
Fire and thermal anomalies in Central Asia
The map shows active fires and thermal anomalies calculated with VIIRS or MODIS data.
Source: NASA Worldview
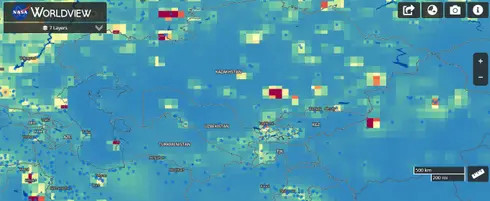
Carbon Monoxide Emission map
The tool demonstrates the information derived from the Modern-Era Retrospective analysis for Research and Applications version 2 (MERRA-2) of NASA based on the Goddard Earth Observing System Model.
Source: NASA Worldview
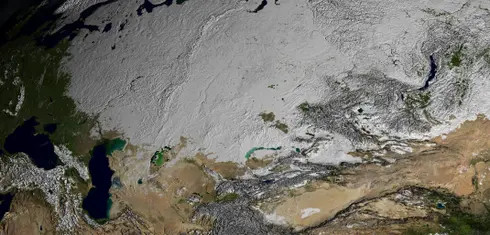
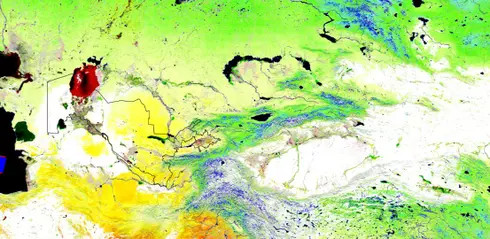
Snow Cover map
The map shows the MODIS Normalized Difference Snow Index (NDSI),which highlights the presence of snow cover over land and water bodies.
Source: NASA Worldview
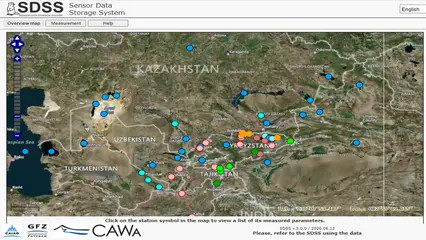
Sensor Data Storage System
Sensor Data Storage System (SDSS) is a database repository containing data from monitoring stations and serving for their use and management.
Climate Change Knowledge Portal
The Portal provides global data on historical and future climate, vulnerabilities and impacts. Explore it via country, region and watershed views. The Portal provides an online platform for access to comprehensive global, regional, and country data related to climate change and development.
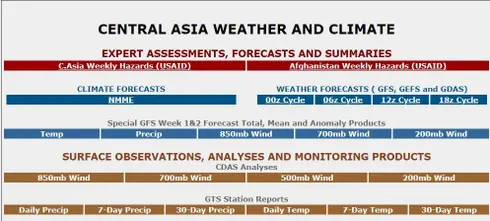
Climate Prediction Center NOAA
The NOAA Climate Prediction Center (CPC) provides graphical outlooks for Africa, Central America, the Caribbean, and Central Asia highlighting areas that might be exposed to reduced crop production or livestock vulnerability due to flooding or drought. The outlooks provide advance notice of food security issues in the regions of interest
Source: https://www.cpc.ncep.noaa.gov/products/international/casia/casia.shtml
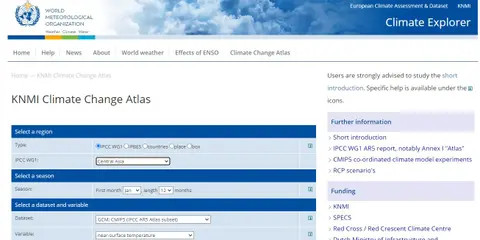
KNMI Climate Change Atlas
This page gives the possibility to plot climate model output for a variety or regions, seasons and variables. It is an extension by KNMI of the IPCC WG1 AR5 Annex I “Atlas”, which due to the restrictions of the printed page could only show a limited number of plots.
Source: KNMI

Health Data Portal of the Republic of Uzbekistan
This tool presents various data in the field of health of the Republic of Uzbekistan. Here You can find such data as a list of hospitals, clinics, pharmacies, health resorts, as well as the register of licenses for medical activities, the register of licenses for pharmaceutical activities in the Republic of Uzbekistan.
Source: http://data.gov.uz/
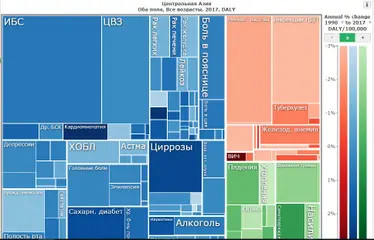
Global Burden of Disease (GBD)
Global Burden of Disease (GBD) allows to analyze data about the world’s health levels and trends from 1990 to 2017 using updated estimates.Compare causes and risks within a country (now at the US state-level), compare countries with regions or the world, and explore patterns and trends by country, age, and gender.
Source: http://www.healthdata.org/gbd